You shouldn’t have missed this on Investazor

Another week has passed with some good market opportunities.

We posted for you on Investazor some interesting analysis and market news. If you didn’t check our site we remind you of some posts in this publication.

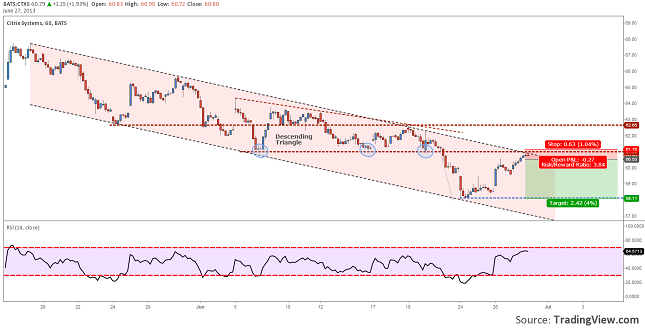
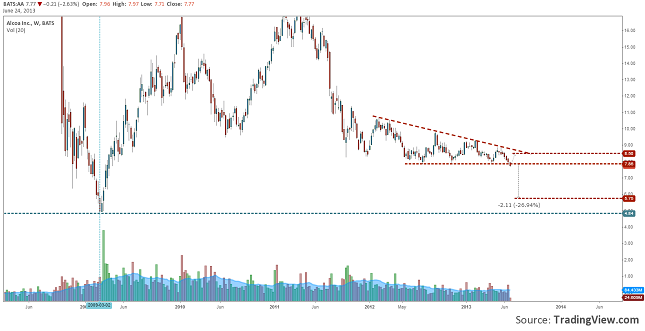
For the stock market we posted Price for Alcoa Inc. Fell Under a Critical Support Level and the Trade Setup Citrix Systems (CTXS) Retested the Trend Line which already touched the mid point to price target.

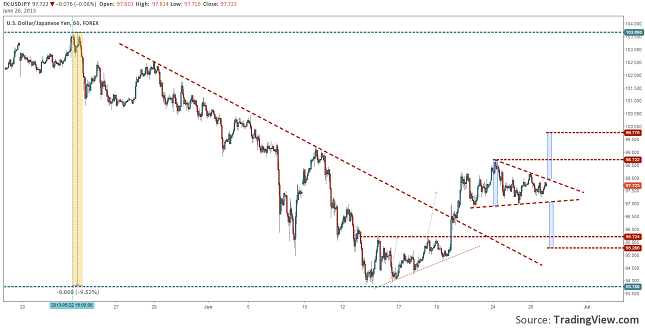
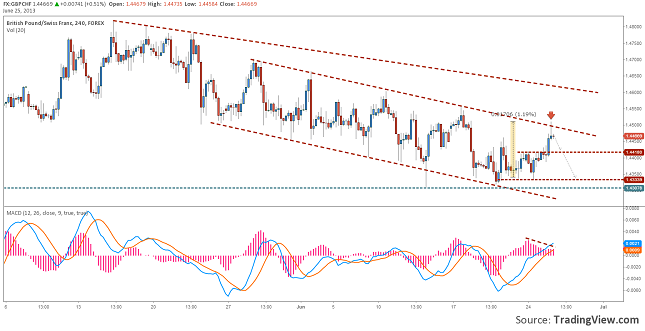
For the Forex market we found interesting GBPCHF Signals a Bearish Move, the price touched the first target and almost hit the full target of the analysis. The same fate had the analysis on USDJPY - USDJPY is Consolidating in a Symmetrical Triangle. The first target hit and the price has to go 40 more pips to hit the second one.

Getting to the news, you could read about China Takes Bold Measures and Euro: Signs of Stability?

Trade Setup Citrix Systems (CTXS) Retested the Trend Line

We are observing this stock for some time.  From 17 May the price has respected a down trend channel. On the last corrective move was drawn a descending triangle. This pattern usually signals a continuation of the down trend. After the 61.00 support level was broke, the price fell right to the target of the triangle, which was near the rejection line.

Now we saw that, on a 60 minutes chart, the price made another correction for the down trend. It rallied from the 58.12 low all the way back to retest the 61.00$ level. In the same area it has also found the trend line. It would be pretty hard for the buyers to break this resistance zone.

Our favorite scenario would be a bounce from the trend line and the round level resistance. If this will happen then a fall might just bring the price back to 58.10 support. A second scenario would be a break and close above the resistance area. In this case the price target would be 62.65 and the Short setup will be considered deactivated.

Confirmation level: 60.53

Take Profit: 58.11

Stop Loss: 61.16

Chart: CTXS, H1
trade-setup-citrix-systems-on-retest-27.06.2013

FX: USDJPY is Consolidating in a Symmetrical Triangle

usdjpy-consolidated-in-a-triangle-26.06.2013

Chart: USDJPY, H1

The Japanese yen started to gain from 22nd of May. Until 13th of June it had managed to appreciate 9.5% in front of the US dollar.

From last week’s monetary policy and press conference of the FED, the dollar started being bought by investors because the inflation risk was diminished. The same thing happened also with the Japanese yen. Under the down trend line we can see that the price had drawn an ascending triangle. This patterns target was hit pretty fast, after it the price had broken the trend’s line.

Under 99.00 level we can see that another triangle consolidation has been drawn. This time the pattern is a symmetrical one. Talking into consideration that the current is now an uptrend we can expect for the price to break the upper line and rally back to 98.72 peak.  The full target for the upward move sits at 99.77.

On the other hand if the price will break the triangle on the down side, a drop back to the 95.70 support area will become more likely.

FX: GBPCHF Signals a Bearish Move

gbpchf-has-drawn-a-shooting-star-25.06.2013

Chart: GBPCHF, H4

The pound has lost ground not only in front of the US dollar, but also in front of the Swiss franc, which is also considered a safe heaven, even though the RBS is trying to keep it at low levels.

From Friday the British pound managed to gain 1% and brought the quotation back to 1.4500, level found right next to the down trend line. On a 4 hour time frame we can see that the price couldn’t close above this round level and draw a Shooting Star candlestick pattern. This would be a first price action signal for a down move.

Talking also into consideration the negative divergence that appeared on the MACD, we can say that a drop under 1.4450 could trigger another fall for the cable back to 1.4420. Under this local support there is nothing that could stop it to go all the way to 1.4350 or even to the Fridays lows at 1.4333.

Even though the signals are pretty bearish we should take into consideration an alternative scenario. For us this would be triggered if the price will close, on a 4 hour time frame, above 1.4500. In this case our price targets will be 1.4550 and 1.4600.

Price for Alcoa Inc. Fell Under a Critical Support Level

The Chinese economy is slowing down and it is getting more visible with every week. The week data coming from the real economy forces the officials to take bold measures. The slowdown is affecting the commodities price, because the country imports less. The price of the industrial metals has fallen constantly for the past several weeks.

alcoa-broke-an-important-support-24.06.2013

Chart: AA, Weekly

The price of aluminum has fallen almost 12% in the past 4 weeks. This drop had a negative impact on the Alcoa Inc. (AA) stock price. It has fallen 11.3% in the past 6 weeks.

A very important support is at 7.85 was tested 4 times in the last year, but only now the sellers pushed the price under it. This level is also the lower line of a descending triangle. If this week will close under lower that 7.85% we can expect a 27% drop to 5.75$ per share. Good support levels are to be found at 7$ and at 6$ per share.

A false break and a close above the 7.85 support could signal another recovery. For the upside the price targets are at 8$ and 8.5$ per share.

Wrap Up 17-21 June EURUSD Down 1.69%

A very interesting week has just passed. The economic data had come mostly above expectations once again.

The service PMIs were all above expectations from the Euro Area. France Manufacturing PMI came above expectations, German’s was under the forecast and the one for the entire Euro Area was in line with expectations. ZEW Economic Sentiment was lower for Germany and above expectations for Europe.

From the US real estate we had a lower Housing Starts indicator but a very good Existing Home Sales. Another surprise was the Philly Fed Manufacturing Index that was estimated at -0.6 and was published 12.5.

Again the economic data seems to be equilibrated, but still the dollar had gained 1.69%. This happened after Ben Bernanke said that they plan to adjust the Quantitative Easing program by the end of 2013 and end it by 2014 if the economy will go as expected. This news had boosted buys for the greenback and made investors to go short on stocks. The capital market fell drastically after this announcement.

wrap-up-eurusd-down-23.06.2013

Chart: EURUSD, Weekly

The same story told from the technical analysis point of view is something like this. EURUSD dropped almost 2 percent last week and we can see an interesting candlestick formation, Bearish Engulfing. This could announce further falls for the euro. The price has stopped for the moment at 50% retrace from the up move. The uptrend would still be in place until the 1.2800 low will broke. Another support area it is found at the 61.8 Fibonacci retrace, near 1.3000.