Activision Blizzard Inc.(ATVI) Drawn a Broadening Formation

ativision-blizzard-drawn-a-broadening-formation-20.06.2013

Chart: ATVI, Daily

Activision Blizzard Inc. (ATVI) is a worldwide publisher of online, personal computer, console handled and mobile interactive entertainment products.

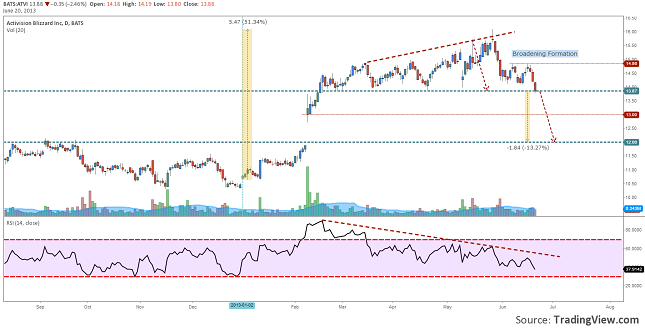
From January 2013 the stock’s price gained over 50%. From March price continued to gain but at a slower pace and started to consolidate in what now we can see as a Broadening Formation. This pattern is usually found in distribution areas and signals a reversal of the uptrend. This type of Broadening is just like a descending triangle turned 180 degrees.

If the price will close under the support line of the pattern, which is 13.90$, we might see a drop that will close the gap made in February. For the target to be met, the price should fall more than 13% to get at 12.00$ per share. An intermediate support can be 13.00$ per share.

A false breakout on this support can be also a good signal for traders. If the price will close above the support line, or an Engulfing pattern will emerge on the support, we can expect a short rally back to 15.00$ per share, or why not, even farther.
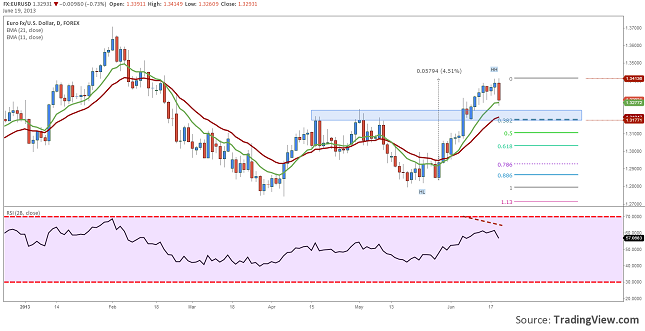
Is it really EURUSD in a Free Fall, or Just a Correction?

eurusd-in-a-corrective-move-19.06.2013

Chart: EURUSD, Daily

From the beginning of this month Euro has gained 4.5% in front of the US dollar. After it broke above 1.32 the trend became unstable and buyers didn’t have enough strength to break 1.34.

Ben S. Bernanke helped today the dollar to gain back a little over 100 pips after he said that the Quantitative Easing program will be tempered until the ending of this year, and shut down in 2014 if the economy will signal recovery and will go towards FED’s forecast. No QE, lower risk of inflation, dollar up, EURUSD down.

Even if this day will close as it is, would it be enough to say that the trend has ended? I don’t think so, not yet. We still have higher highs and higher lows; the price is still above the 11 and 21 days EMA layer. If this isn’t enough, we will go on and say that in the same layer it is also found the round level 1.3200 and 38.2 Fibonacci retrace.

These are enough to think that we have a very good support area and it will be pretty hard for EURUSD to be in a free fall. If this will be just a corrective move, then the smartest thing to do is to wait for the reversal signal/confirmation and act.

Trade Setup on Dell Inc. Targeting a 10% Drop

trade-setup-dell-on-10-percent-drop-18.06.2013

Chart: DELL, Daily

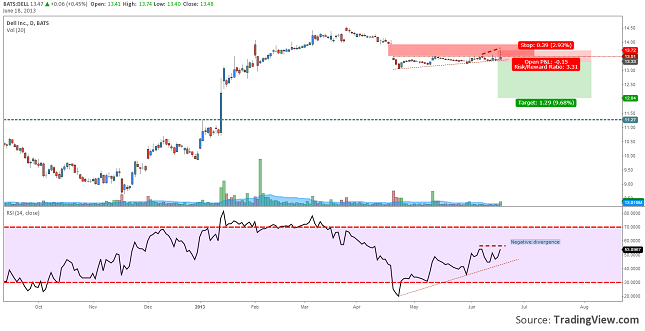
Do you also find Dell a boring stock? Well for the past 2 months it has moved in a 40 cents range. In my opinion this market remained calm enough time and we might be surprised in the near future.

Looking at the price action of the stock I saw the resistance at 13.50/51. Buyers tried to move up and cover the gap April 18th, but seller came right back and pushed the price back under the resistance. This can only mean that the bears are still stronger.

Keeping in mind this and seeing that the 14 days RSI barely touched the 50 level and made a negative divergence might just be enough to think at a bearish trade setup.

We have the signals, we just need the confirmation. My confirmation would be a drop under the local support from 13.35. This might trigger other sell orders or even trigger the buyers stops and collapse the price back to 12$ per share.

FX: GBPCHF Takes a Second Test on the Head and Shoulder’s Baseline

gbpchf-second-retest-on-baseline-17.06.2013

Chart: GBPCHF, Daily

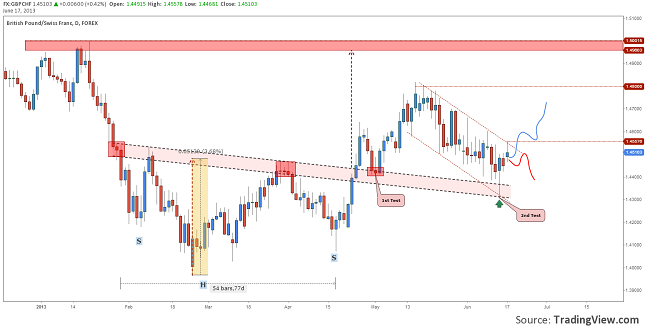
During 77 days, from the 30th of January to mid of April, the price of GBPCHF has been in an accumulation area. Here an Inverted Head and Shoulders was formed. The price pattern was broken and confirmed in the middle of April.

After the price broke the pattern’s base line, it came back and retested the area. Another rally took place, and new highs were hit around 1.4800. From there a down trend has started which can be limited by to parallel lines. Meaning the down trend is actually a down channel, which brought the price back to the baseline testing it for the second time. In this area we can see a pretty impressive Hammer which announced a bounce.

Now we can set up some conditions and parameters to forecast the future price movement. Our favorite scenario would be a break above 1.4560 which would trigger new rallies that will get the price back to 1.48. Above this level new highs are to be made until 1.5000.

Our backup scenario would be triggered if a daily close would go under 1.4400. In this case the target price would be 1.43.

Wrap up 10-14 June EURUSD up 1.15%

Another week has passed and the single European currency has continued to gain in front of the US dollar, even though the economic releases were quite balanced.

Europe reported a very good industrial production, above expectations. France surprised also with a 2% growth above the analysts forecasts. USA reported stagnation in this sector, but better retail sales, it gained 0.6%. The US Unemployment claims dropped at 334K and it was better than expected ad better than the previous number.

The inflation reports showed a Core CPI of 1.2% for Europe, in line with the forecast, and a Producer Price Index of 0.5%, 0.4% above expectations, for USA. Last week was closed with the release of the UoM Consumer Index. This indicator was pretty disappointing because it dropped to 82.7.

wrap-up-eurusd-heading-for-prz-16.06.2013

Chart: EURUSD, Daily

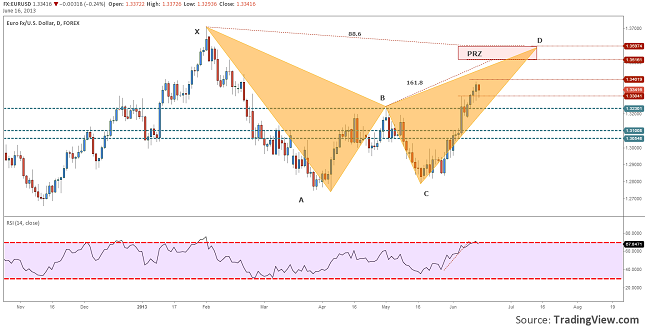
The technical analysis looks a little bit better than the macroeconomic one. Last Sunday the price set under 1.33 and we were thinking about a Bearish Bat with the PRZ between 1.35 and 1.36. Today the price is under 1.34. If it will break this barrier too, than the probability for the PRZ to be hit will be higher.

Hot Articles on Investazor this Week

Another week has passed by, with less macroeconomic publications and a lower volatility than in the beginning of the month, but with pretty hot articles published on our site. If you did not visit us this week, this are the most important publishes you should take a look over.

If we are talking about Forex, then you shouldn’t have missed the AUDUSD analysis - AUDUSD Positive RSI Divergence confirmed by Hammer . We were expecting a rise from 0.9400 to 0.9600 after some technical indications were in line.  The price hit 0.9660 and fell again under 0.96.

One of the hottest stocks analysis was Bed Bath & Beyond Inc. (BBBY) has got to a Cross Roads. The price hit several targets after the firs forecast that we did several months ago and now it seems to have got to a sensitive point. You should not miss it, maybe you will find an interesting setup to trade.

With our fast news articles we kept you updated on the most important events of the week. Some of them are U.S. Remember An Old Problem, The OMT Program Is On The Table and Uncertainty Defines United Kingdom.